
The tools enable quicker formatting with fewer clicks and dynamic formatting options. Users can access features such as data editing, global properties, series customization, and data labels. Advanced functions include growth lines, delta lines, axes breaks, and connector lines for enhanced analysis, easily accessed and applied.
Overview of the empower® charting tools
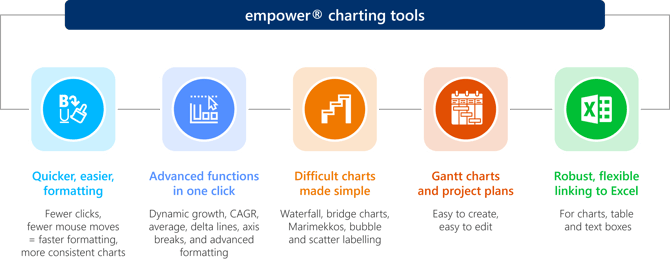
How to use the empower® charting tools to create interesting and charts
How to access the empower® charting tools
|
Formatting options
|
How to edit data
|
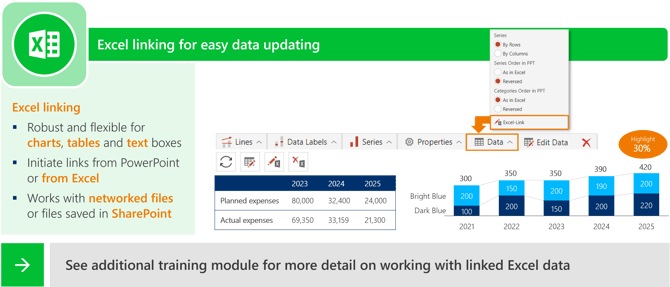
Further data formatting and Excel linking
|
Chart properties
|
Editing data series options
|
Data label editing
|
Advanced charting functionality
|
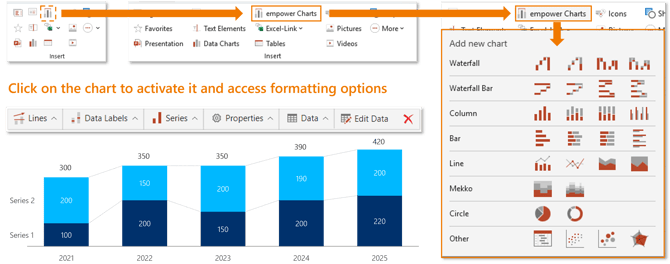
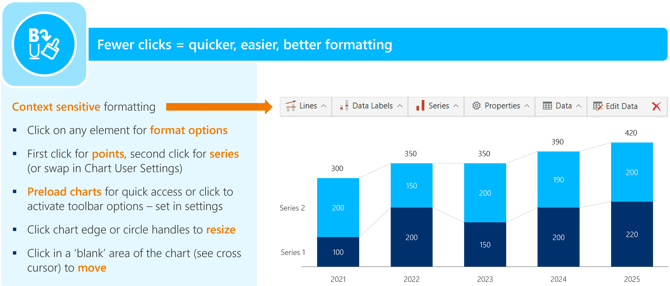
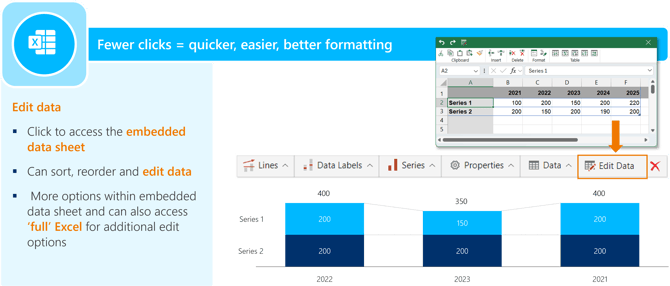
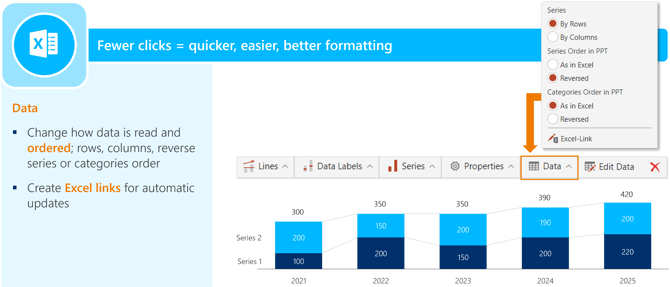
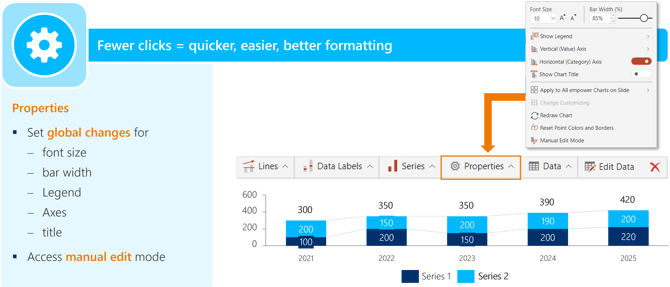
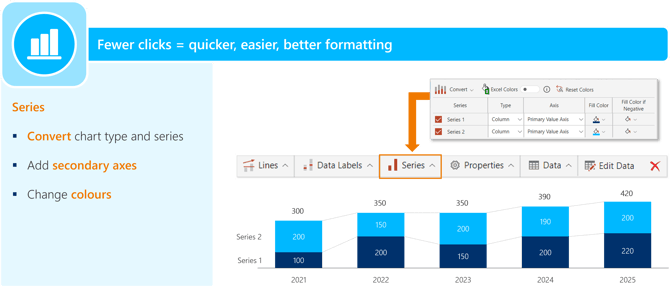
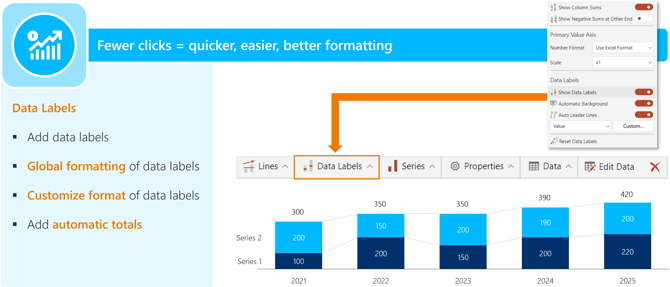
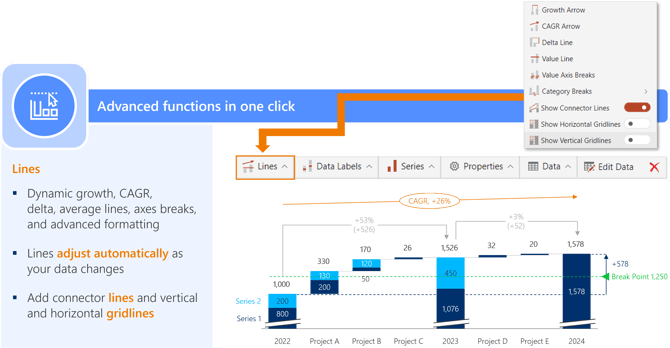
Chart types
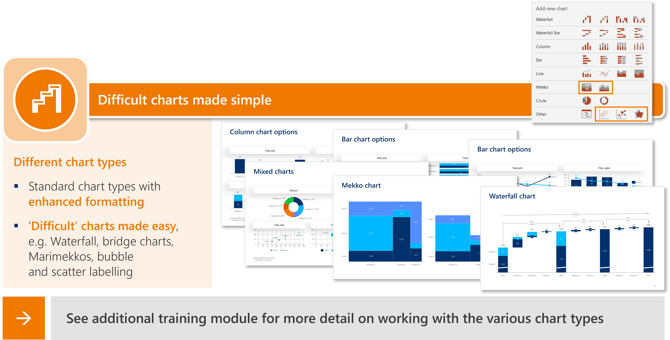
Available chart types
|
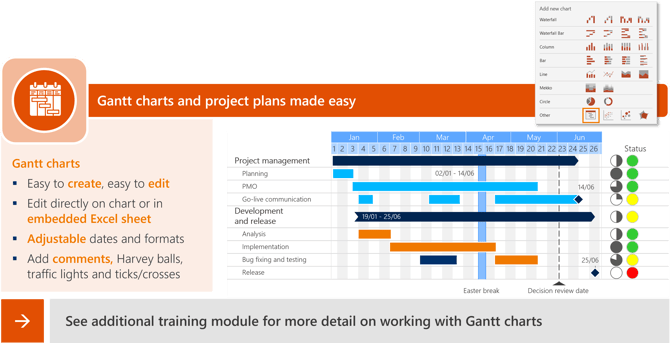
Gantt charts
|
Excel linking
Watch this video for more details on how to use empower® to create charts and create extensive data visualisations using our charting tools.

 Book a call or a meeting to learn how empower® Express can help you and arrange a demo
 Contact us (support@empower.express) if you have any questions
 Click here to learn more and sign up for a free trial
 Click here to book a call with our technical support team